- The Real Estate Report
- Posts
- Dubai Real Estate Weekly Market Analysis 21st-July-2025
Dubai Real Estate Weekly Market Analysis 21st-July-2025
The total real estate transactions in Dubai for Week 29 was AED 8.16 billion and 4,424 transactions. Off-plan contributed 66.4% or 5.42 billion, while Ready properties contributed 33.6% or 2.74 billion.
Week 29 saw Dubai’s real estate market record a total transaction value of AED 8.16 billion, down 52.0 % from AED 16.99 billion in Week 28. The number of deals fell to 4,424, a 48.1 % decrease from 8,526 a week earlier.
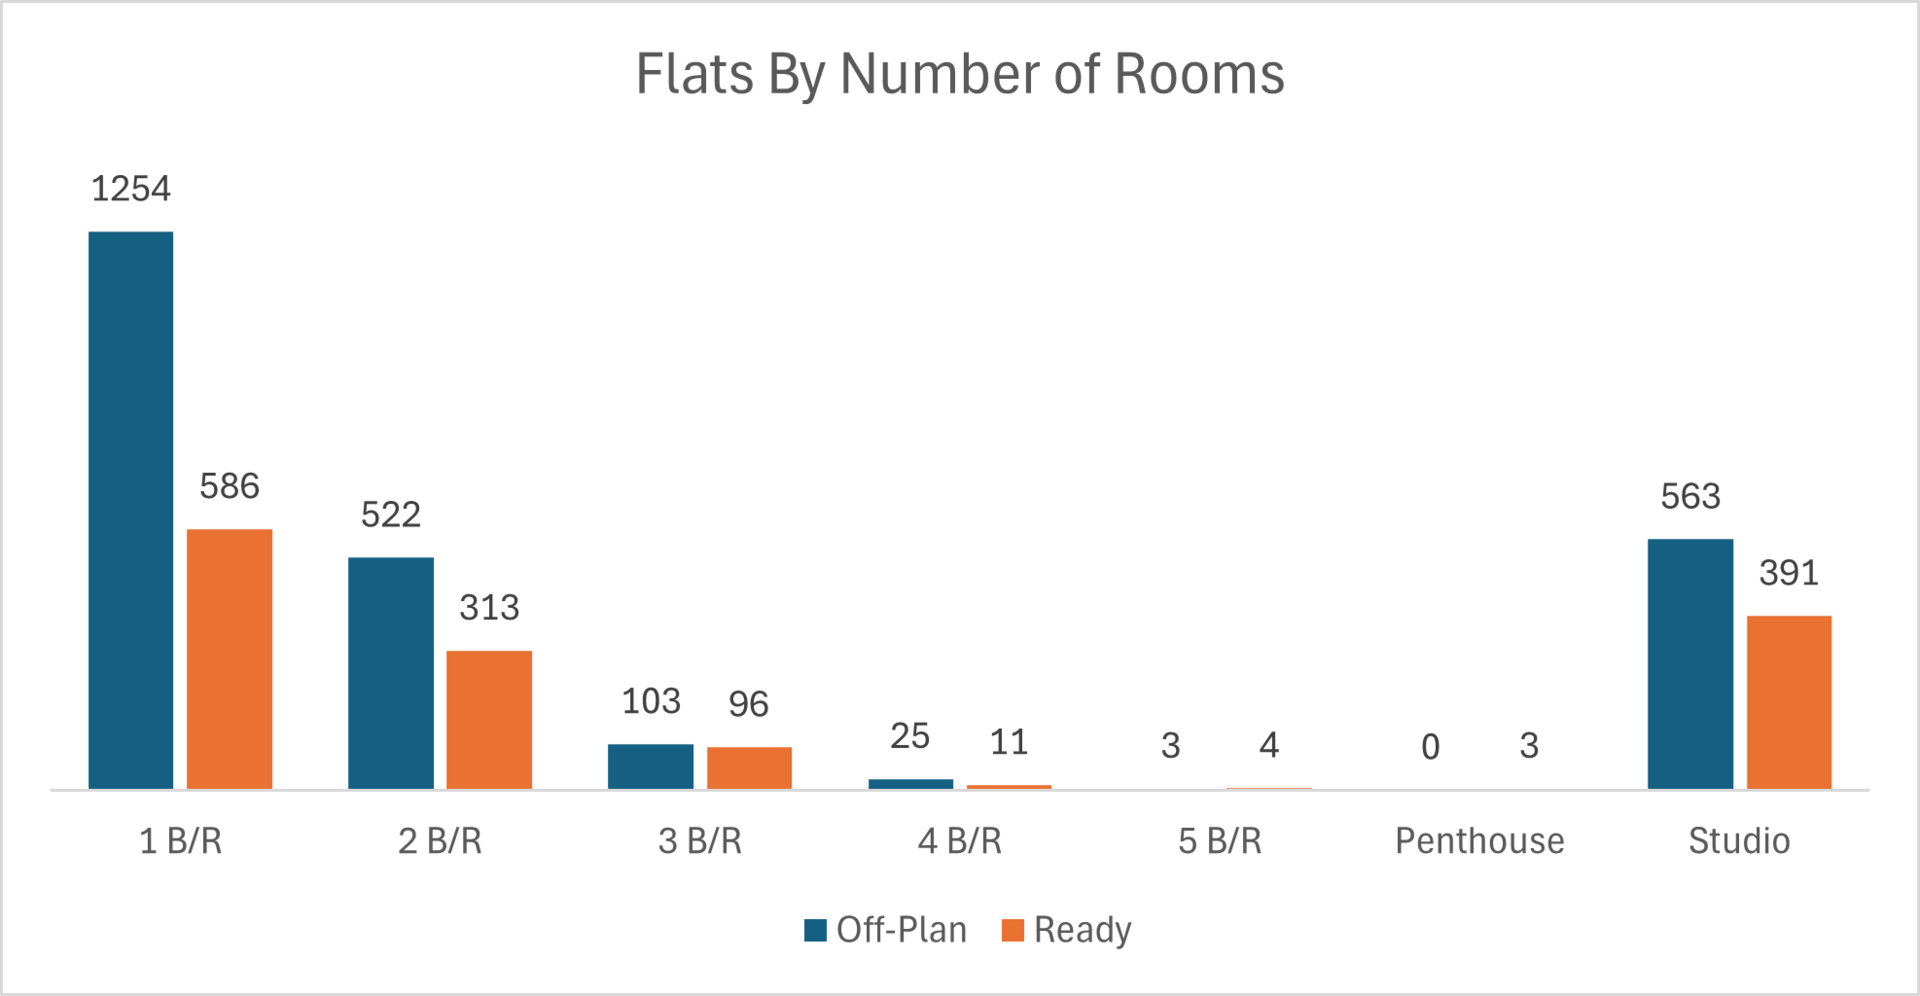
Oneberoom Flats were the most traded, with 1,840 transactions.
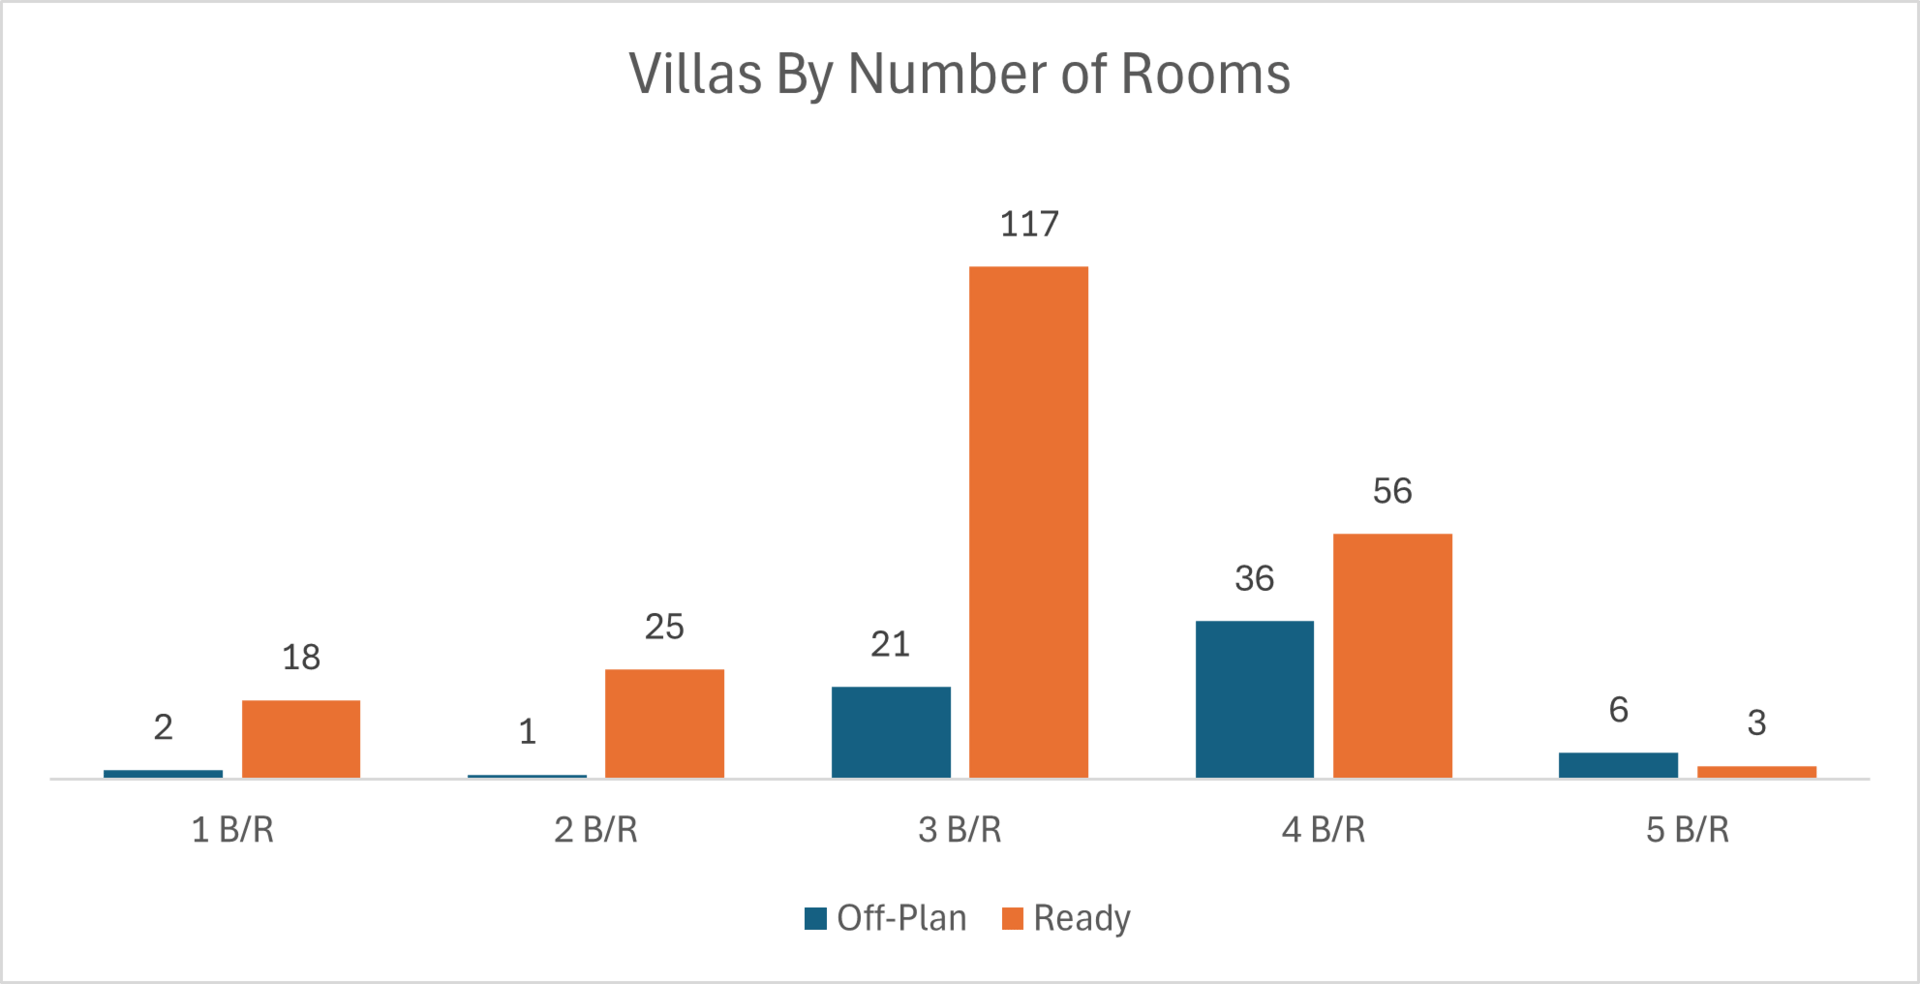
3-Bedroom & 4-Bedroom villas dominated the villas with 230 transactions combined.
The total number of flats traded reached 3,874, while the villas accounted for 285 villa.
Category | Off-Plan (AED million) | Ready (AED million) |
|---|---|---|
Flats | 4,857.4 | 1,788.9 |
Villas | 296.1 | 622.6 |
Hotel Apts & Rooms | 47.5 | 94.1 |
Commercials | 215.2 | 236.9 |
Total | 5,416.1 | 2,742.5 |
Off-Plan Market Performance
Total Value: AED 5.42 billion
Share of Total Value: 66.4 %
Subcategory Breakdown
Subcategory | Value (AED millions) | % of Off-Plan |
|---|---|---|
Flats | 4,857.4 | 89.7 % |
Villas | 296.1 | 5.5 % |
Hotel Apts & Rooms | 47.5 | 0.9 % |
Commercials | 215.2 | 4.0 % |
Flats dominated the off-plan segment, accounting for nearly 90 % of off-plan value.
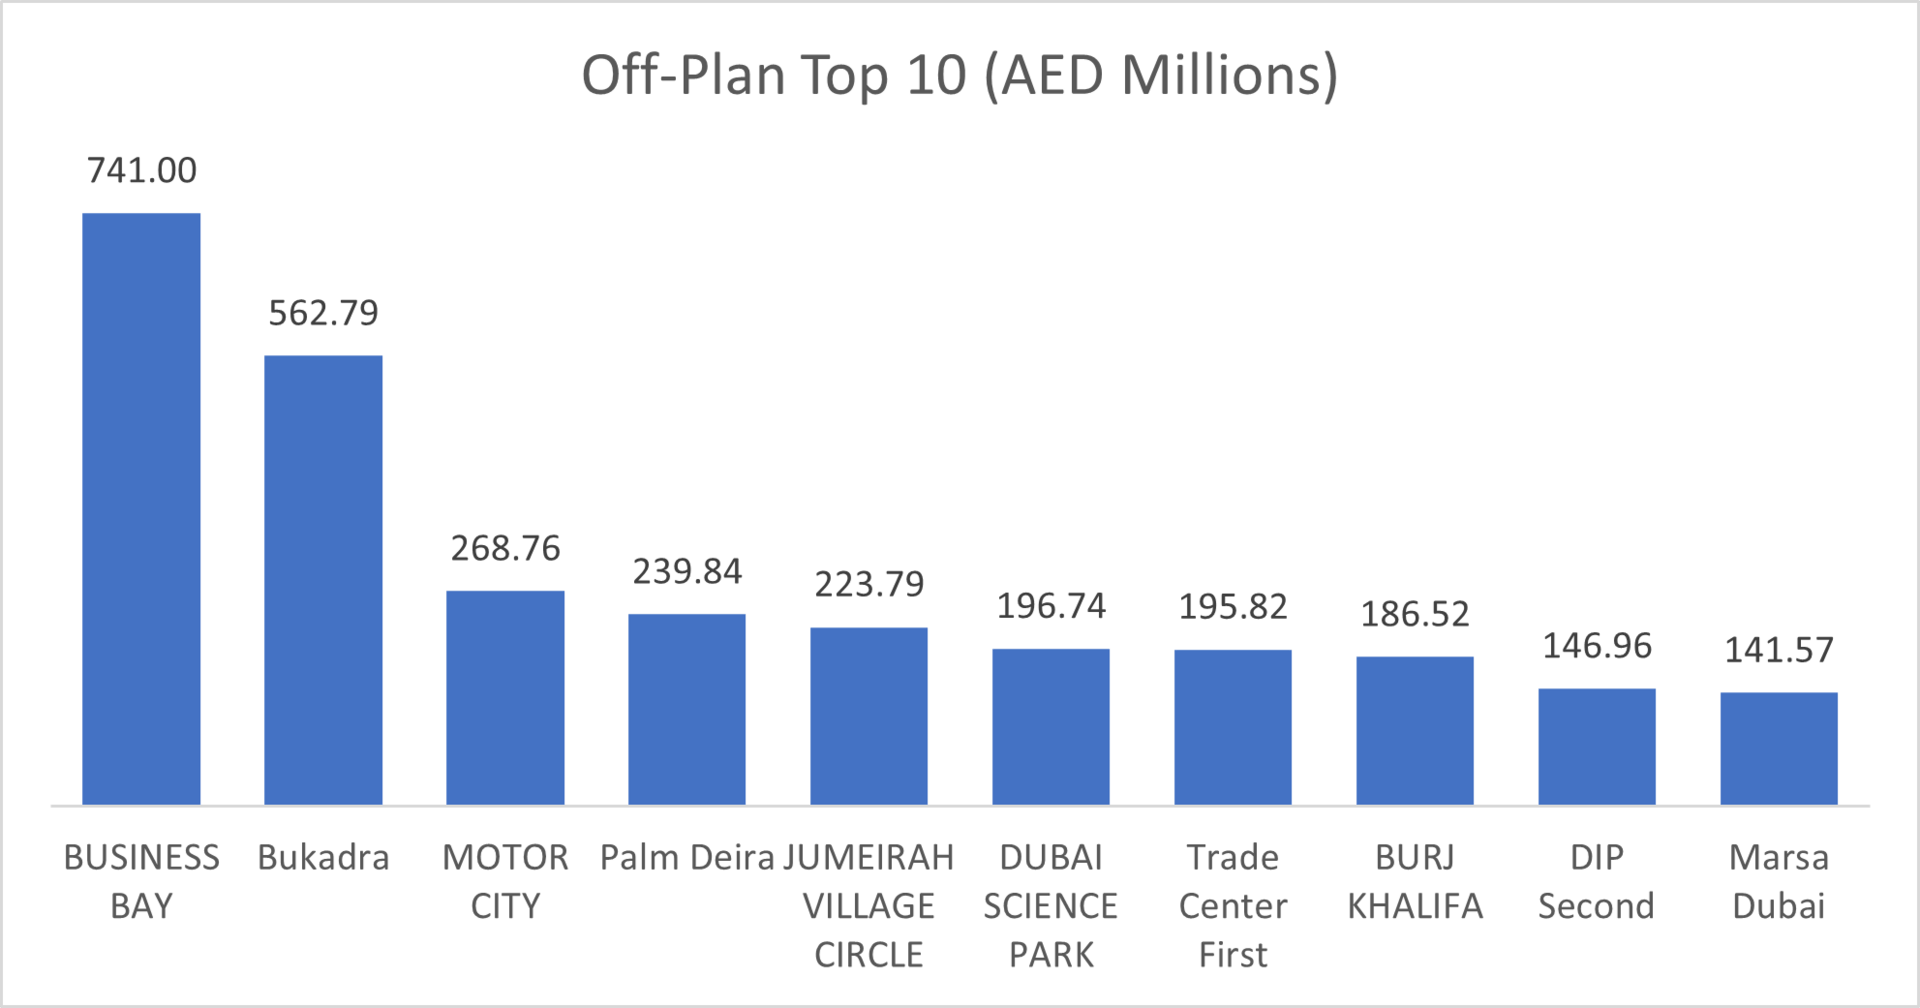
Top Performing Off-Plan Areas (by Value Traded)
Area | Value (AED millions) |
|---|---|
Business Bay | 741.0 |
Bukadra | 562.8 |
Motor City | 268.8 |
Palm Deira | 239.8 |
Jumeirah Village Circle | 223.8 |

Ready Market Performance
Total Value: AED 2.74 billion
Share of Total Value: 33.6 %
Subcategory Breakdown
Subcategory | Value (AED millions) | % of Ready |
|---|---|---|
Flats | 1,788.9 | 65.2 % |
Villas | 622.6 | 22.7 % |
Hotel Apts & Rooms | 94.1 | 3.4 % |
Commercials | 237.0 | 8.6 % |
Flats led the ready segment, contributing two-thirds of its total value.
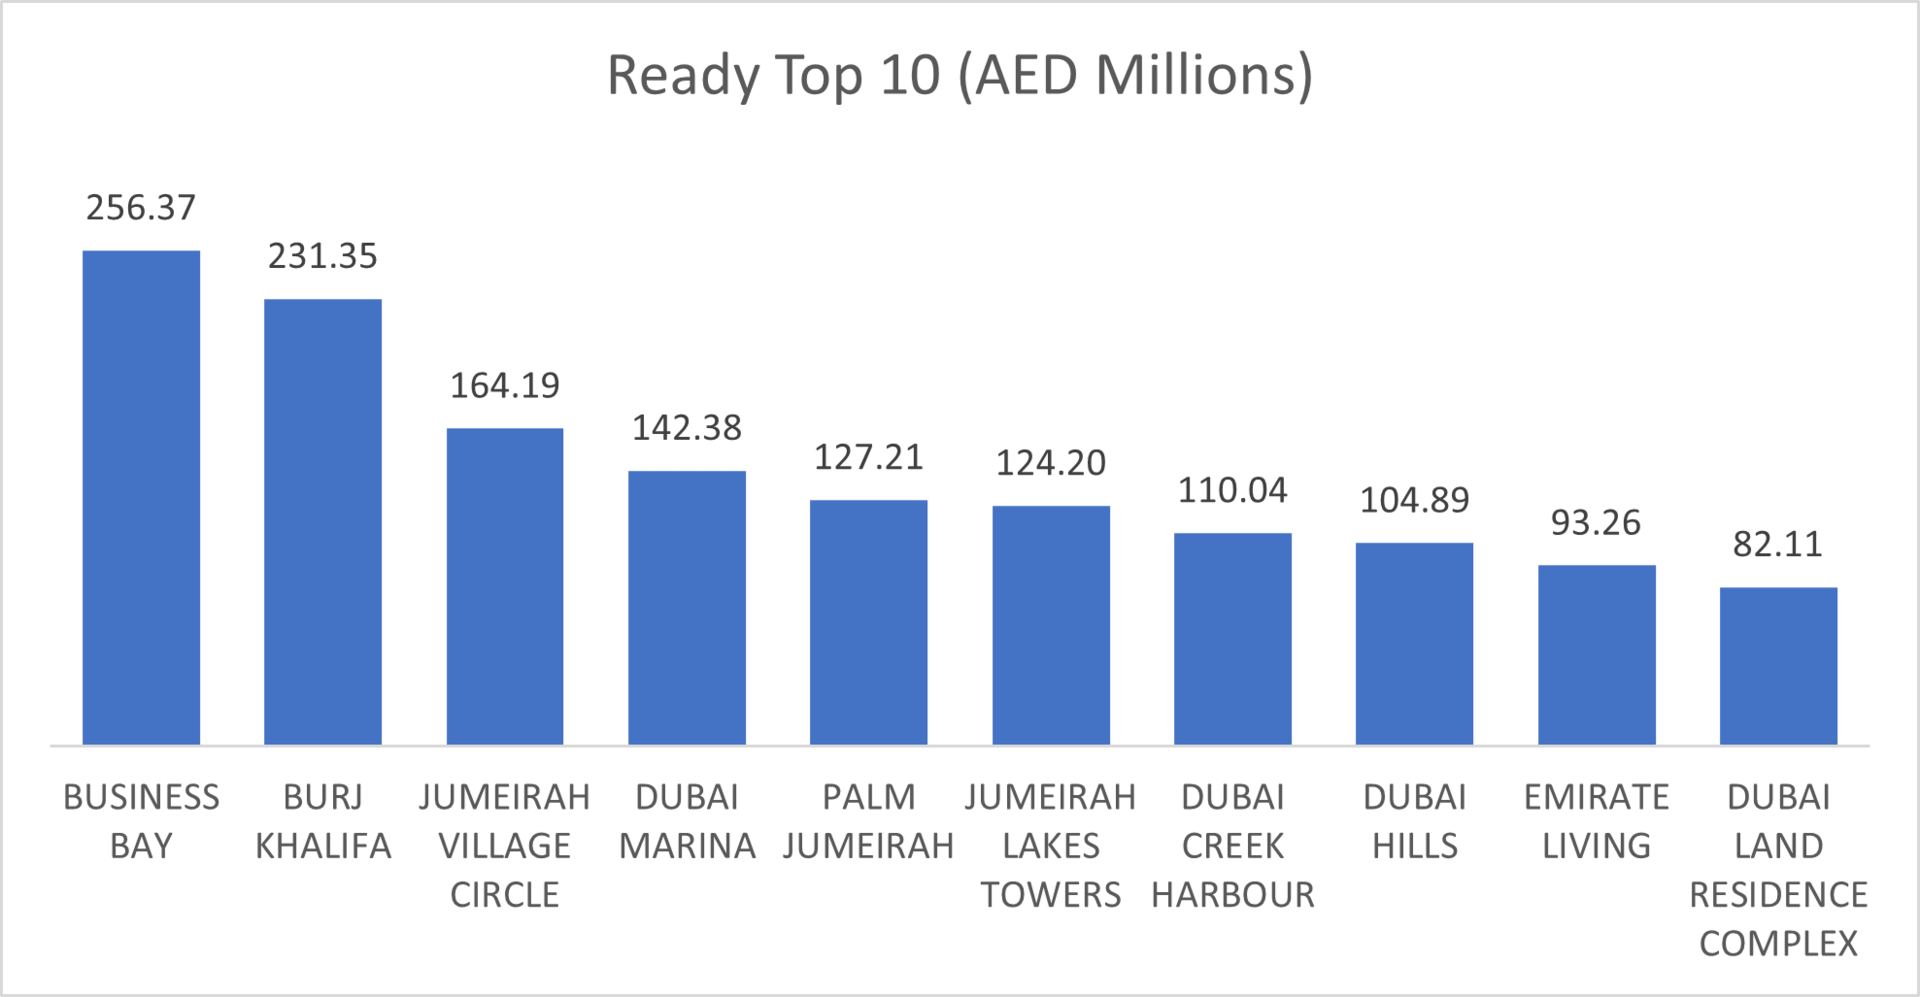
Top Performing Ready Areas (by Value Traded)
Area | Value (AED millions) |
|---|---|
Business Bay | 256.4 |
Burj Khalifa | 231.3 |
Jumeirah Village Circle | 164.2 |
Dubai Marina | 142.4 |
Palm Jumeirah | 127.2 |

On the micro level, below is the sales distribution based on the number of bedrooms


Weekly Comparison
Metric | Week 28 | Week 29 | Change |
|---|---|---|---|
Total Volume | AED 16.99 B | AED 8.16 B | –52.0 % |
Transactions | 8,526 | 4,424 | –48.1 % |
Market Insights & Outlook
Off-plan retained its lead, driven overwhelmingly by apartment sales, while Villas and Commercials saw modest contributions. Business Bay continued to lead across both segments, underscoring its appeal to investors even amid lighter volumes. Looking ahead, forthcoming project launches and promotional incentives may help stabilize activity as the market enters the final quarter.
Data Source: Dubai Land Department
Reply