| Check out our new website |

|
|
AboutTheUAE is your definitive guide to Dubai—discover top schools, visa requirements, housing insights, transport tips, shopping hotspots, entertainment and more.
|
Dubai’s real estate market experienced a slight pullback in Week 26 of 2025, with total transactions reaching AED 8.76 billion, a 1.6% decrease compared to AED 8.90 billion recorded in Week 25. The number of deals also fell to 4,298 transactions, down from 4,907 the week before, marking a cooling in activity across both off-plan and ready segments.
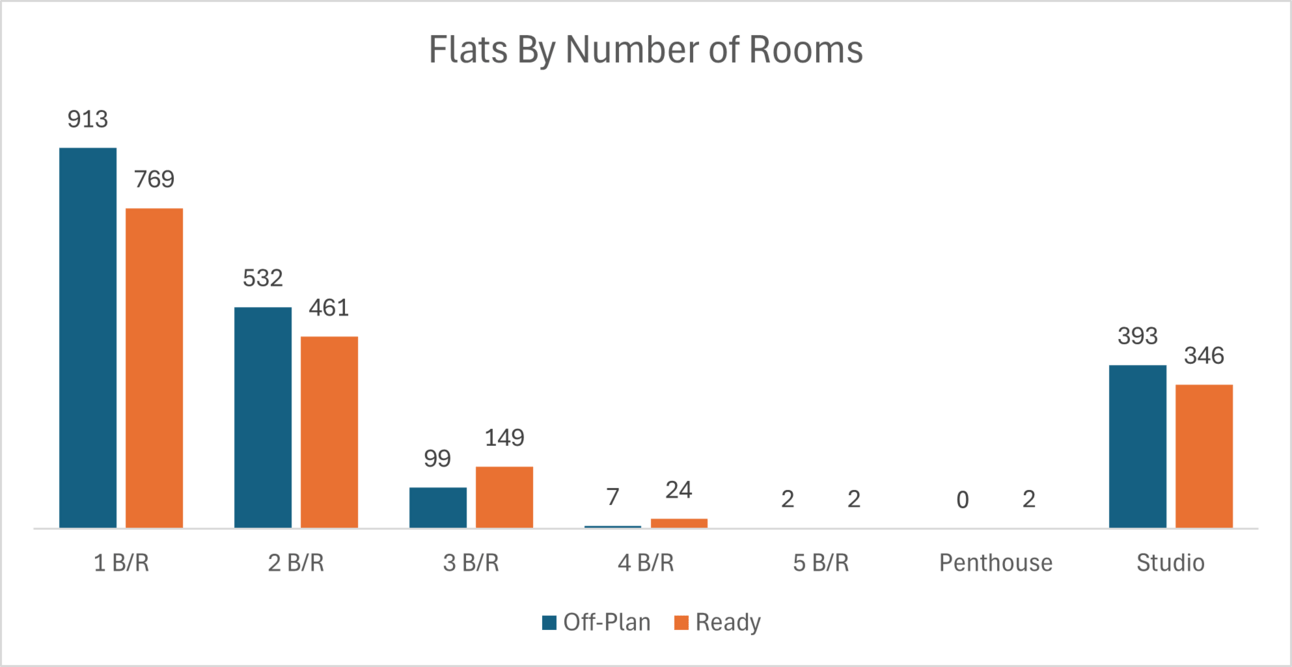
Oneberoom Flats were the most traded, with 1,682 transactions.
3-Bedroom & 4-Bedroom villas dominated the villas with 308 transactions combined.
The total number of flats traded reached 3,699, while the villas accounted for 369 transactions.
Category | Off-Plan (AED million) | Ready (AED million) |
|---|---|---|
Flats | 4,319.9 | 2,691.8 |
Villas | 504.0 | 755.0 |
Hotel Apartments & Rooms | 36.1 | 89.4 |
Commercials | 33.9 | 331.3 |
Total | 4,893.8 | 3,867.5 |

Off-Plan Market Performance
Total Value: AED 4.89 billion
Share of Total Transactions: 55.9%
The off-plan segment accounted for 55.9% of the overall weekly transaction value. Among subcategories:
Subcategory | Value (AED millions) | % of Off-Plan |
|---|---|---|
Flats | 4,319.9 | 88.3% |
Villas | 504.0 | 10.3% |
Hotel Apartments & Rooms | 36.1 | 0.7% |
Commercials | 33.9 | 0.7% |
Total | 4,893.8 | 100% |
Apartments remained the dominant off-plan asset class, accounting for over 88% of segment volume. Villas contributed 10.3%, while hotel and commercial units together made up just 1.4%.
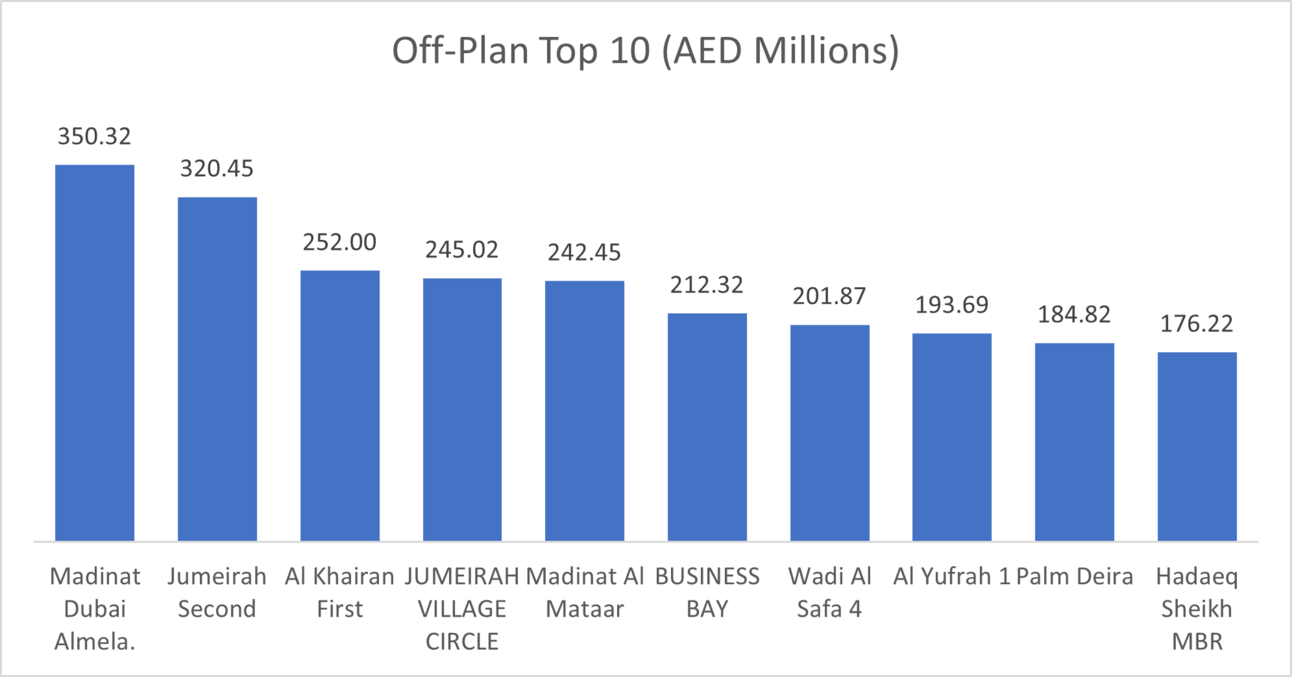
Top Performing Off-Plan Areas (by Value Traded)
Area | Value (AED millions) |
|---|---|
Madinat Dubai Almelaheya | 350.3 |
Jumeirah Second | 320.4 |
Al Khairan First | 252.0 |
Jumeirah Village Circle | 245.0 |
Madinat Al Mataar | 242.4 |
These five communities alone accounted for AED 1.41 billion, or 28.8% of all off-plan transactions this week.

Ready Market Performance
Total Value: AED 3.87 billion
Share of Total Transactions: 44.1%
The ready segment made up 44.1% of the weekly transaction value. Among subcategories:
Subcategory | Value (AED millions) | % of Ready |
|---|---|---|
Flats | 2,691.8 | 69.6% |
Villas | 755.0 | 19.5% |
Hotel Apartments & Rooms | 89.4 | 2.3% |
Commercials | 331.3 | 8.6% |
Total | 3,867.5 | 100% |
Flats again led the ready market, comprising nearly 70% of value, while villas added 19.5% and commercials captured a notable 8.6%.
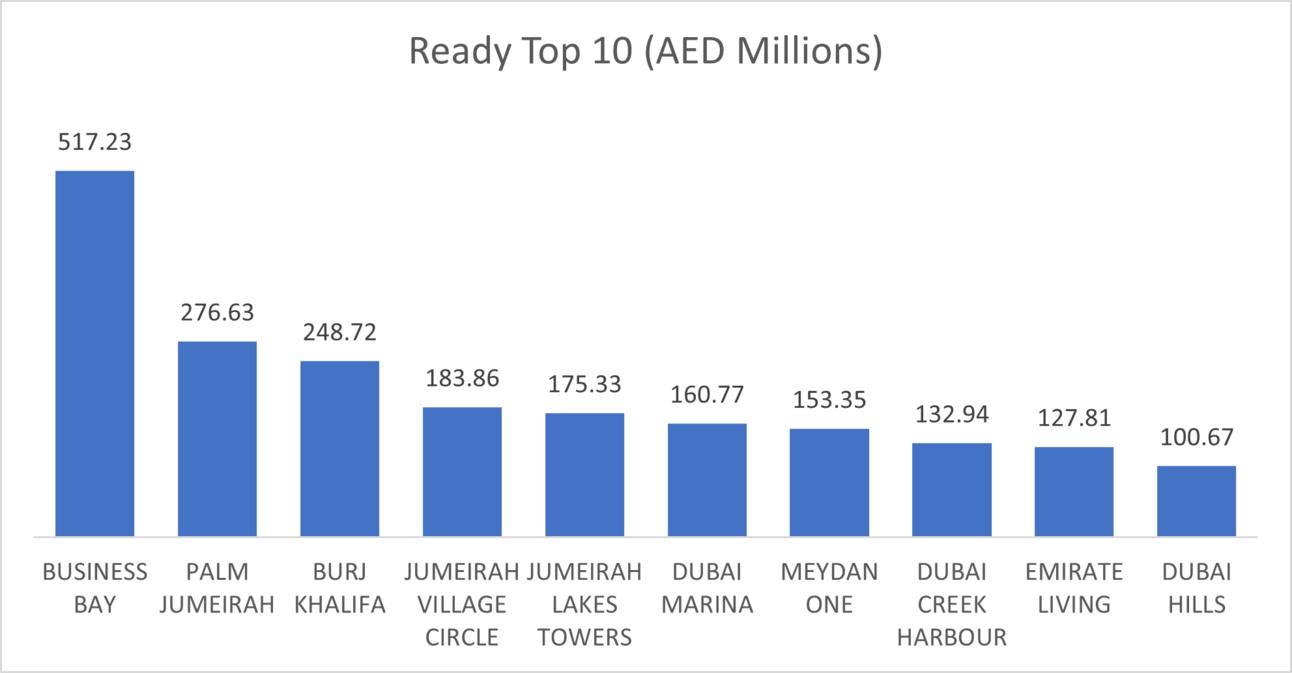
Top Performing Ready Areas (by Value Traded)
Area | Value (AED millions) |
|---|---|
Business Bay | 517.3 |
Palm Jumeirah | 276.6 |
Burj Khalifa | 248.7 |
Jumeirah Village Circle | 183.9 |
Jumeirah Lakes Towers | 175.3 |
These top five districts represented AED 1.40 billion, or 36.3% of ready transactions.

On the micro level, below is the sales distribution based on the number of bedrooms


Weekly Comparison
Metric | Week 25 | Week 26 | Change |
|---|---|---|---|
Total Volume | AED 8,904,954,115 | AED 8,761,346,927 | –1.6% |
Transactions | 4,907 | 4,298 | –12.4% |
Market Insights & Outlook
Despite this week’s dip, off-plan assets remain the market driver, led by sizeable flat deals in communities such as Madinat Dubai Almelaheyah and Jumeirah Second. The concentration of nearly 29% of off-plan activity in the top five areas underscores sustained demand for prime new developments.
In the ready segment, the strength of flats persists, but the 8.6% share captured by commercials hints at growing institutional or portfolio-level interest, especially in Business Bay.
Data Source: Dubai Land Department
