
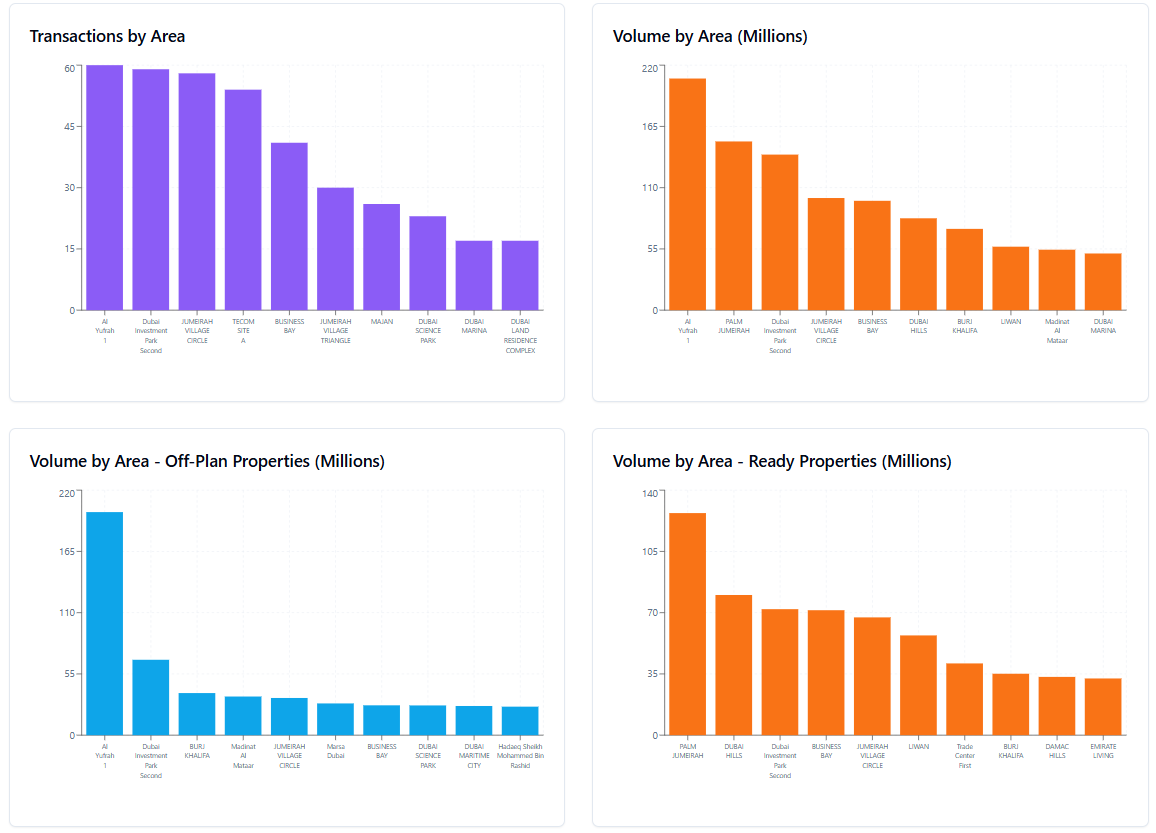
Dubai closed November 2025 with AED 76.52 billion in property transactions across 21,200 deals. This represents a 4.5% increase month-on-month versus October 2025’s AED 73.20 billion, and a 35.3% increase year-on-year versus November 2024’s AED 56.56 billion. Transaction count fell 6.3%, from 22,618 in October to 21,200 in November, indicating higher average ticket sizes despite fewer deals.
Metric | November 2025 | October 2025 | MoM Δ | November 2024 | YoY Δ |
|---|---|---|---|---|---|
Total value | AED 76.52 bn | AED 73.20 bn | ▲ 4.5 % | AED 56.56 bn | ▲ 35.3 % |
Transactions | 21,200 | 22,618 | ▼ 6.3 % | — | — |
Market Composition
Segment | Value (AED bn) | Share of Total | Key Drivers |
|---|---|---|---|
Land | 31.74 | 41.5% | Large-ticket plot sales and strategic site acquisitions; active developer land banking. |
Off-Plan | 28.77 | 37.6% | Strong launch pipeline; apartment-led demand in mid-market and emerging hubs. |
Ready | 16.01 | 20.9% | Broad secondary sales with a tilt toward established communities and family villas. |
Off-Plan Market Performance
Sub-category | Value (AED bn) | % of Off-Plan |
|---|---|---|
Flats | 24.36 | 84.7% |
Villas | 2.97 | 10.3% |
Hotel Apt. & Rooms | 0.08 | 0.3% |
Commercial | 1.36 | 4.7% |
New-build apartments overwhelmingly carried off-plan spend, with nearly 85% of off-plan dirhams flowing into flats. Villas contributed just over 10%, reflecting healthy interest in townhouse and villa projects, while commercial and hospitality remained niche but meaningful.
Top Performing Areas
Area | Value (AED bn) | % Of Off-Plan |
|---|---|---|
Business Bay | 2.06 | 7.2% |
Madinat Al Mataar | 1.63 | 5.7% |
Palm Deira | 1.60 | 5.6% |
Jumeirah First | 1.50 | 5.2% |
Dubai Maritime City | 1.43 | 5.0% |


Business Bay dominated the off-plan market, capturing around 7.2% of off-plan traded value (AED 2.06 bn) and recording 675 transactions. Jumeirah Village Circle (JVC) stayed firmly on top of the transactions chart with 1,005 off-plan deals and still generated a sizeable AED 1.18 bn in value. High-volume activity also concentrated in Jumeirah Village Triangle (733 deals), Madinat Al Mataar (720), Dubai Land Residence Complex (668) and Dubai Maritime City (650), underlining the strength of mid-market and emerging waterfront communities such as Palm Deira and the historic creekfront corridors.
The average price per square meter for off-plan flats stood at AED 24,958 up 5% from last month, while off-plan villas averaged AED 16,353, down 19% from last month.
Ready Market Performance
Sub-category | Value (AED bn) | % of Ready |
|---|---|---|
Flats | 10.73 | 67.0% |
Villas | 3.20 | 20.0% |
Hotel Apt. & Rooms | 0.63 | 3.9% |
Commercial | 1.45 | 9.1% |
Secondary sales stayed apartment-heavy, with flats accounting for about two-thirds of ready spend. Villas made up 20% of the ready market, highlighting persistent demand from end-users and upgraders, while commercial and hospitality assets together contributed just over 13%.
Top Performing Areas
Area | Value (AED bn) | % Of Ready |
|---|---|---|
Burj Khalifa (Downtown) | 1.79 | 11.2% |
Business Bay | 1.20 | 7.5% |
Palm Jumeirah | 0.97 | 6.1% |
Dubai Marina | 0.96 | 6.0% |
JVC | 0.80 | 5.0% |


In the ready market, the Burj Khalifa district topped the value charts with AED 1.79 bn, around 11.2% of all ready transactions, and 366 deals. Business Bay ranked second by value (AED 1.20 bn) and posted 616 ready transactions, confirming it as a core liquidity hub. JVC led by number of ready deals with 705 transactions, while also featuring in the top-five by value (AED 0.80 bn). Alongside Palm Jumeirah and Dubai Marina, these areas together accounted for roughly one-third of total ready market value, underscoring the concentration of demand in well-established, amenity-rich communities.
The average price per square meter for Ready Flats stood at AED 16,238 1% higher than last month, while Ready Villas averaged AED 13,932, 2% higher than last month average.
Land Transactions (Value)

Total land transactions in November reached AED 31.74 billion, driven by large-plot trades in key master communities and strategic acquisitions for future mixed-use and residential projects. The scale of land activity signals continued confidence from developers in Dubai’s medium-to-long-term demand trajectory.
On the Micro Level


Market Insights & Outlook
Higher values, fewer deals: A 4.5% rise in total value alongside a 6.3% drop in transactions points to larger average ticket sizes and a shift toward higher-value assets, especially in prime and waterfront locations.
Land-heavy expansion: With land representing over 41% of total traded value, November was a land-driven month, indicating active pipeline replenishment and new project planning across multiple corridors.
Apartment-led demand: Flats continued to dominate both segments (84.7% of off-plan and 67.0% of ready value), aligning with affordability, investor preference for easily rentable stock, and the sheer breadth of apartment inventory.
Concentrated hotspots: Business Bay, JVC, Burj Khalifa, Palm Jumeirah and Dubai Marina remained bellwethers—leading by value, volume, or both. Off-plan momentum clustered in JVC, JVT, Madinat Al Mataar and Palm Deira, while ready liquidity concentrated in Downtown, Business Bay and the key waterfront districts.
Outlook: Heading into year-end and early 2026, momentum looks firm but more selective. Buyers are increasingly focused on micro-location, quality of product, payment flexibility and handover visibility, while developers continue to lock in land and push new launches in the strongest demand corridors.
Data Source: Dubai Land Department